
Mini Projects Gathering-2
This page collects several mini-projects that use GPIO, ADC, timers, and interrupts with different sensor modules. Pick a project that matches your interest (and the chili rating next to each title). The goal is to get hands-on practice, learn how the sensors work, and share what you find with each other.
Common settings for all projects
Start here before you open a specific project. Almost every project uses the same CubeMX clock setup, UART/sprintf printing on the serial monitor, and the same platformio.ini. Timing-sensitive projects (distance measurement, DHT11) may use 216 MHz instead of 108 MHz; that is noted in the clock steps below.
Common project start and clock configurations
- Open a new STM32CubeMX project.
- Select STM32F767 board, start project, but DO NOT SELECT default mode. You can also select “Yes” for memory protection popup.
- You should see some pins are orange. We want these to be gone, as well:
Pinout (at the top) > Clear pinouts - First set the clock On the left
System Core > RCC > HSE: Crystal/Ceramic Resonator(RCC: Reset and Clock Control) - Master Clock Output: Checked. (only for a possible debugging)
- We will have 108MHz HCLK pretty much all of the projects. If your project is sensitive to time like distance measurement, DHT11 communication, then you can select 216 MHz, which is the maximum clock frequency for this microcontroller.
- Go to Clock Configuration. Set these values:
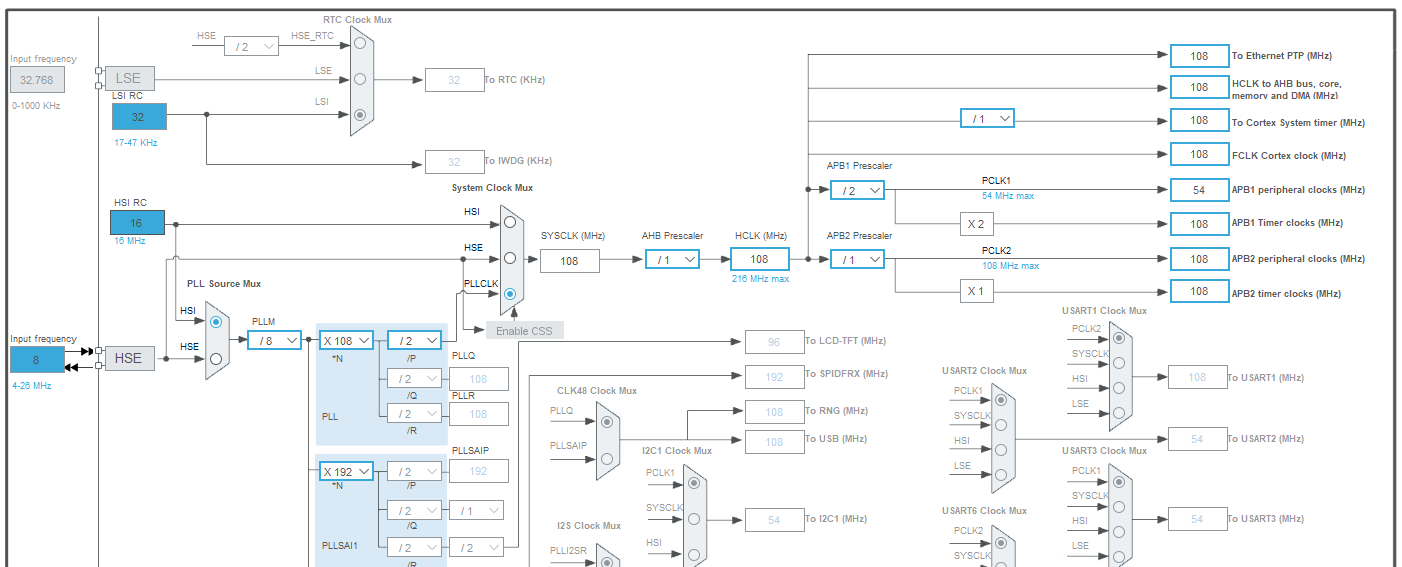
Configure your sprintf
To make debbugging a bit easier, let’s enable terminal printing. It will make more sense what’s going on here after Lecture 7 - UART: Universal Asynchronous Read and Write. since we are using serial print. However, we can give a try to set up UART without going into details yet.
- Go to
Connectivity > USART3 > Mode > Asynchronous. - Replace PB10->PD8 and PB11->PD9 by dragging the pin while holding Ctrl.
- Do other necessary configurations of your project. The printing-on-terminal-related work is done for now.
When you open your project in PlatformIO, follow these steps:
- Make sure that your
platformio.inicontains:debug_build_flags = -O0 -g -ggdbandmonitor_speed = 115200as well as-Wl,-u,_printf_floatbuild flags if you plan to print something in float. The common platformio.ini in this page has all, so you can just reuse it. - Paste this code after
/* USER CODE BEGIN Includes */#include<string.h> // for strlen() #include<stdio.h> // for sprintf() - Paste this code after
/* USER CODE BEGIN 1 */char uart_buf[50]; // This will hold your text to be printed. Adjust the length if needed int uart_buf_len; - Paste this code after
/* USER CODE BEGIN 2 */// Initial text on the screen uart_buf_len = sprintf(uart_buf, "Print Test\r\n"); HAL_UART_Transmit(&huart3, (uint8_t *)uart_buf, uart_buf_len, 100); - If you want to print more things, you should just copy-paste the code-snipped for
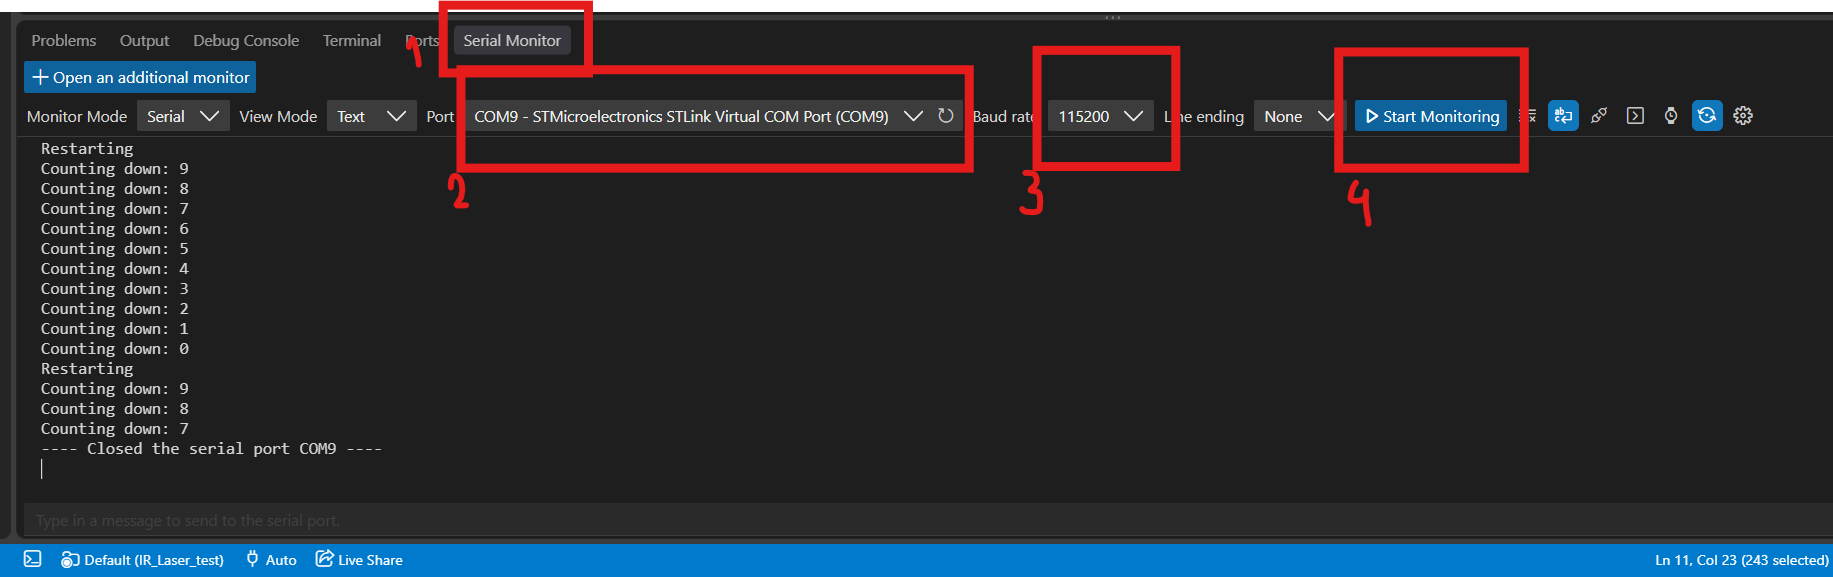
uart_buf_lenchanging the text in it, andHAL_UART_Transmit. - After you upload your code and ready to see some outputs in your project. Do these steps:
- Serial monitor
- Select the correct ST-Link port
- Make sure the baudrate is correct 115200
- Start monitoring
Common platformio.ini
Since we might need debugging and float printing I have adjusted all possible things you might need in this platformio.ini
[env:nucleo_f767zi]
platform = ststm32
board = nucleo_f767zi
framework = stm32cube
build_flags =
    -IInc
    -Wl,-u,_printf_float
upload_protocol = stlink
debug_tool = stlink
debug_build_flags = -O0 -g -ggdb
monitor_speed = 115200
Chilli-meter next to the projects 🌶️
P1: Digital sensor modules - magnetic switch, tilt and vibration sensing 🌶️
So far, our only experience with a GPIO input has been a simple push button, but that button represents far more than it seems. Many sensors are simply switches operated by something other than a finger, such as a magnet, gravity, or vibration, so everything you learned about reading a button applies directly to them.
A digital sensor reports only one of two states: HIGH (logic 1) or LOW (logic 0). In many simple sensors this is done with a mechanical or electrical switch that opens or closes in response to a physical event, such as a nearby magnet, a change in orientation, or a mechanical shock. The microcontroller reads this state on a GPIO pin configured as an input, either by polling the pin in a loop or by using an external interrupt (EXTI) that triggers when the signal changes.
Because a switch that is open leaves the input pin “floating”, a pull-up or pull-down resistor is needed to define a stable default level. The STM32 provides internal pull-up/pull-down resistors that can be enabled in the GPIO configuration, so an external resistor is often not required. Mechanical switches also tend to bounce, producing several rapid transitions for a single event, so the input may need to be debounced in software (e.g., by ignoring changes for a few milliseconds after the first edge).
Reed switches, tilt sensors, and vibration sensors are common examples of such switch-based digital sensors:
-
Reed switch: two thin ferromagnetic contacts sealed in a glass tube. When a magnet is brought close, the contacts are pulled together and the switch closes. Typical uses are door/window sensors and position detection.
- Tilt sensor: a small metal ball inside a housing or a metal conducting liquid like mercury that connects two contacts when the sensor is upright and disconnects them when it is tilted beyond a certain angle.
-
Vibration sensor: a spring or similar element that briefly makes contact when the sensor is shaken or knocked, producing short pulses on the output.
- Touch sensor: usually a capacitive sensing module that detects the change in capacitance when a finger touches (or comes near) the pad, and outputs a clean digital signal. It has no moving parts, so it does not bounce.
Sometimes an analog sensor is packaged in a digital module. Such modules typically include a comparator (e.g., LM393) that compares the analog sensor signal with a threshold set by an onboard potentiometer. The module then provides a digital output (often labelled DO) that switches HIGH or LOW when the threshold is crossed. Some modules also expose the raw analog signal on a separate AO pin.
⚠️ The STM32F767 GPIOs use 3.3 V logic. Power the sensor modules from the 3.3 V pin of the Nucleo board where possible. Only some pins are 5 V tolerant, so check the datasheet before connecting a module powered from 5 V.
The available sensors for such a project are these for today:
| Sensor | Quantity |
|---|---|
| Reed switch | 3 |
| Tilt sensor | 6 |
| Vibration sensor | 2 |
| Touch sensor | 1 |
You see that some sensor modules have their builtin LED that gives you indication without programming anything. It reminds us to be a good embedded system designer, in terms of efficiency, you don’t always need a processor. Think smart!
Project steps
- Choose your digital sensor.
- Find the pinout of your sensor module online and set up your circuit. Pay attention to the supply voltage (3.3 V vs. 5 V) and identify which pin provides the digital output.
- Start your STM32CubeMX project as explained in the common project setup at the top of this page. In this step, decide which GPIO pin the sensor will be connected to and configure it as an input, enabling the internal pull-up or pull-down resistor if your module needs one.
- Generate the initial code and open the project in PlatformIO.
- Your program must start by printing a header message on the serial monitor, e.g. “Welcome to the reed switch project”.
- Then, once every second, it should print whether the sensor has detected anything, e.g. “Magnet detected” or “No magnet”.
- +🌶️ Modify your code so that the program prints “Hello world” every second, but reports a sensor detection immediately when it happens, without waiting for the next one-second tick. (Psst: interrupts! And/or replace
HAL_Delay()with a timer.)
P2: Analog sensor modules - Hall effect, water level, light (LDR) 🌶️🌶️
In digital sensor modules, the sensors could only tell us whether something happened: a magnet was near or not, the sensor was tilted or not. Most physical quantities in the real world, however, are not simply on or off. Light can be dim or bright, a magnetic field can be weak or strong, and a water level can be anywhere between empty and full. Analog sensors capture this by producing a voltage that changes continuously with the measured quantity, and in this project we will read that voltage with the microcontroller’s analog-to-digital converter (ADC).
An ADC measures the voltage on an input pin and converts it into a number. The STM32F767 has 12-bit ADCs, which means the result is a value between 0 and 4095, where 0 corresponds to 0 V and 4095 corresponds to the reference voltage (3.3 V on the Nucleo board). The measured voltage can therefore be calculated as voltage = raw_value * 3.3 / 4095. Only certain pins are connected to the ADC, so you must choose a pin that supports an analog input channel (on the Nucleo board, the pins labelled A0–A5 are a good starting point). Keep in mind that analog readings are never perfectly stable: small fluctuations caused by electrical noise are normal, and averaging several samples is a simple way to get a smoother value.
Many analog sensors are based on the same idea: a material whose electrical properties change in response to a physical quantity. A classic example is the strain gauge, a thin metal foil pattern glued onto a surface. When the surface is stretched, the foil becomes slightly longer and thinner, which increases its resistance; when it is compressed, the resistance decreases. This change is tiny, so strain gauges are usually connected in a Wheatstone bridge and followed by an amplifier, as in the load cells used in digital scales. The sensors in this project rely on similar material effects: in an LDR, light frees charge carriers in a semiconductor and lowers its resistance; in a Hall effect sensor, a magnetic field deflects the moving charges in a semiconductor and creates a small voltage across it; and in the water level sensor, water itself acts as the conductor between the traces. In every case, the change in resistance or voltage is converted into a voltage that the ADC can measure, most often with a simple voltage divider.
The analog sensors in this project work as follows:
- 49E Hall effect sensor: a linear sensor that outputs a voltage proportional to the strength of the magnetic field passing through it. With no magnet nearby, the output sits at roughly half of the supply voltage. Bringing one pole of a magnet closer raises the voltage, while the opposite pole lowers it, so the sensor can detect both the strength and the polarity of a magnetic field. Unlike the reed switch in, it has no moving parts and gives a gradual rather than an on/off response.
- Water level sensor: a board with a series of exposed parallel copper traces. Water conducts electricity between the traces, so the more of the board is submerged, the higher the output voltage. Since the traces corrode when current flows through them in water, it is good practice to power the sensor only while taking a measurement, for example by supplying it from a GPIO output pin.
- LDR module: a light-dependent resistor (photoresistor) whose resistance decreases as the light intensity increases. On the module, the LDR forms a voltage divider with a fixed resistor, which turns the change in resistance into a change in voltage. Depending on how the divider is wired, the output may increase or decrease with more light, so test this before interpreting your readings. Many LDR modules also include a comparator with a digital output (DO), just like the modules described in P1; in this project, use the analog output (AO).
⚠️ The ADC input must never exceed 3.3 V. Power the sensor modules from the 3.3 V pin of the Nucleo board, so that their output voltage can never go above the ADC’s measurable range. A module powered from 5 V may output voltages that damage the input or saturate the reading at 4095.
The available sensors for such a project are these for today:
| Sensor | Quantity |
|---|---|
| 49E Hall effect sensor | 1 |
| Water level sensor | 1 |
| LDR module | 1 |
| LDR sensors* | 10 |
(*) You must setup your own voltage divider circuit.
Project steps
- Choose your analog sensor.
- Find the pinout of your sensor module online and set up your circuit. Make sure the module is powered from 3.3 V and identify which pin provides the analog output.
- Start your STM32CubeMX project as explained in the common project setup at the top of this page. In this step, choose an ADC-capable pin for the sensor and enable the corresponding ADC channel.
- Configure your ADC pin(s) as we discussed in Lecture 5: ADC Lecture.
- Generate the initial code and open the project in PlatformIO.
- Your program must start by printing a header message on the serial monitor, e.g. “Welcome to the light sensor project”.
- Then, once every second, it should read the ADC and print both the raw value (0–4095) and the corresponding voltage, e.g. “Raw: 2048, Voltage: 1.65 V”. +🌶️ Feel free to find the datasheet of the module and do the calculation of the physical entity from the voltage - like the magnetic flux density in millitesla (or gauss) for the Hall effect sensor, or the approximate light intensity in lux for the LDR.
- Observe how the readings change as you vary the measured quantity (move a magnet, dip the sensor into water, cover the LDR) and note the minimum and maximum values you see. Use these values to print a meaningful message, e.g. “Dark”, “Normal”, or “Bright”, or the water level as a percentage.
- Discuss what is the sensitivity of your measured value. How can you improve it?
P3: Single-digit 7-segment display 🌶️🌶️
In digital/analog sensor module projects, the microcontroller was listening to the outside world through its input pins. In this project, we turn things around and use GPIO pins as outputs to show information to the user. You have already done this in its simplest form by blinking an LED, and a 7-segment display is really nothing more than eight LEDs packed into one housing and arranged so that they can form the digits 0–9 (and even a few letters). Driving the display is therefore just a matter of switching the right combination of LEDs on and off at the same time.
This project is double-chilli just because you need to be careful about selecting good pins, writing some more advanced code with c-arrays. Just it. Not too complex still I promise.
The seven bar-shaped LEDs of the display are called segments and are labelled a to g, starting with the top segment and going clockwise, with g being the middle one. Most displays also have an eighth LED for the decimal point, labelled dp. To show a digit, you turn on a specific set of segments: for example, the digit 1 uses segments b and c, while the digit 8 uses all seven. A convenient way to handle this in code is a lookup table, an array in which each entry stores the segment pattern of one digit as a bit pattern, so that displaying a number becomes a matter of reading the array and writing each bit to the corresponding pin.
To save pins, the LEDs inside the display share one common connection, and this is where the two types of 7-segment displays differ. In a common cathode display, which is the one I have, all the LED cathodes are connected together to GND, and a segment lights up when its pin is driven HIGH. In a common anode display, just another version, all the anodes are connected together to the supply voltage, and a segment lights up when its pin is driven LOW, meaning the logic in your code is inverted. The two types look identical from the outside, so you need to check the part number, the datasheet, or simply test the display (carefully, with a resistor) before writing your code.
Just like any LED, each segment needs a current-limiting resistor in series; a value around 220–330 Ω works well at 3.3 V. You can etiher one resistor per segment rather than a single resistor on the common pin to ensure the perfect brightness, or use one at the common ground to save number of components used in the project.
⚠️ One more time im case you didn’t read the previous paragraph: Never connect a segment directly to a GPIO pin without a resistor. Each STM32 pin can only supply a limited current, and the total current of all pins is limited as well, so too much current can damage both the display and the microcontroller. USE AT LEAST 220Ω RESISTOR AT THE COMMON GROUND!!
Project steps
- Find the datasheet or pinout of your display. This is a common cathode display so you don’t need to worry about deciding it :)
- Set up your circuit: connect each segment (a–g, and optionally dp) to a GPIO pin through its own resistor, and connect the common pin to GND or 3.3 V depending on the display type.
- Start your STM32CubeMX project as explained in the common project setup at the top of this page. In this step, decide which GPIO pins to use for the segments and configure them as outputs. Choosing pins on the same port (e.g. all on port E) will make the bonus step easier.
- Generate the initial code and open the project in PlatformIO.
- Your program must start by printing a header message on the serial monitor, e.g. “Welcome to the 7-segment display project”.
- Create a lookup table with the segment patterns of the digits 0–9 and write a function that displays a given digit, e.g.
display_digit(uint8_t digit).- If you define pinss and ports as a C-array, like
GPIO_TypeDef* SEG_PORTS[7]={PinA_Port, PinB_Port...}andconst uint16_t SEG_PINS[7] = {PinA_Pin, PinB_Pin...}andconst uint8_t digit_map[10][7] = {LEDS to be turned on for nr 0: {1, 1, 1, 1, 1, 1, 0}, LEDS to be turned on for nr 1: {0, 1, 1, 0, 0, 0, 0}}, and then loop over in the main loop, your life can be easier.
- If you define pinss and ports as a C-array, like
- Make the display count from 9 to 0 and start over, changing the digit once every second, and print the currently shown digit on the serial monitor as well.
- +🌶️ Add a push button or a digital sensor module. Turn off all the LED as soon as it detects an input.
P4: Laser-IR security 🌶️
You have probably seen it in movies: a museum or a bank vault protected by a web of laser beams, and the moment someone breaks one of them, the alarm goes off. In this project, we build a simple version of this security system. It uses three simple concepts: a GPIO output to switch on the laser, a GPIO input to read the receiver, and a program that reacts to what happens in between.

The system consists of two parts facing each other. The laser module (transmitter) emits a narrow, focused beam of light. The receiver module is placed on the opposite side so that the beam falls directly on its sensor, and it outputs a digital signal that indicates whether it currently receives light. As long as the beam reaches the receiver, everything is safe. When someone (or something) crosses the beam, the light is blocked, the receiver output changes state, and the microcontroller raises an alarm. This type of setup is called a break-beam sensor, and the same principle is used in garage door safety sensors, elevator doors, and object counters on conveyor belts.
⚠️ Laser safety: Never look directly into the laser beam and never point it at anyone’s eyes, including via reflections from mirrors or shiny surfaces. Even low-power laser modules can damage the eye.
⚠️ Check the current consumption of the laser module in its datasheet. If it requires more current than a GPIO pin can safely supply, do not power it directly from the pin; instead, switch it through a transistor or power it from the supply pin of the Nucleo board.
Project steps
- Find the datasheets of the laser module and the receiver module, and identify the pinout, supply voltage, and output behaviour (does the receiver output go HIGH or LOW when it receives light?).
- Set up your circuit. Connect the laser to a GPIO pin configured as an output, so that your program can switch it on and off, and connect the receiver output to a GPIO pin configured as an input.
- Align the laser and the receiver so that the beam hits the receiver’s sensor. Aligning a narrow beam on a breadboard can be tricky, so use the female-male jumper wires to take the modules off the breadboard and fix them in place, for example with tape or modelling clay, on two objects facing each other.
- Start your STM32CubeMX project as explained in the common project setup at the top of this page, and configure the laser and receiver pins.
- Generate the initial code and open the project in PlatformIO.
- Your program must start by printing a header message on the serial monitor, e.g. “Welcome to the laser security system”, and then switch on the laser.
- Continuously check the receiver and print “Safe” as long as the beam reaches the receiver and “Warning!” as soon as the beam is interrupted. You can either poll the input or use an interrupt; with an interrupt, even a very quick hand movement through the beam will be detected.
I have only one set of modules for this project but if more are interested I have IR transceiver module which does practically the same thing.
P5: DHT11 humidity and temperature sensor 🌶️🌶️🌶️🌶️
Now we’re talking about proper chilli projects. To be honest, I wasn’t sure whether to include this one at this level, because it requires a bit of signal-processing thinking and some careful timing. But it’s also one of the most satisfying projects on this page, and once it works, you’ll understand what is really going on inside all those sensor libraries you might otherwise just download and use.
Not every sensor is simply digital or analog. Inside, the sensing element itself is usually still analog, but many sensors include a small chip that measures the element, applies calibration, and sends the result to the microcontroller as digital data using a communication protocol. This has real advantages: a digital signal is much less sensitive to noise and long wires than a small analog voltage, the calibration is done in the factory so you don’t have to do it yourself, and the data can include a checksum so that you can detect transmission errors. Well-known protocols such as UART, I2C, and SPI are handled by dedicated hardware peripherals in the STM32, but some sensors use their own simpler, proprietary protocols. For those, there is no peripheral that does the work for you, and you have to generate and read the signal yourself by switching a GPIO pin and measuring time very precisely. This technique is often called bit-banging.
The DHT11 is exactly this kind of sensor. It contains two sensing elements: a resistive humidity sensor, made of a moisture-absorbing material between two electrodes whose resistance changes with the relative humidity of the air, and an NTC thermistor, whose resistance decreases as the temperature rises. A tiny 8-bit microcontroller inside the sensor measures both, applies calibration coefficients stored in its memory, and sends the results over a single data wire. The DHT11 measures relative humidity from about 20 to 90 % with an accuracy of ±5 %, and temperature from 0 to 50 °C with an accuracy of ±2 °C. It’s not a precision instrument, but it’s cheap, simple, and perfect for learning. Note that it should not be read more often than once per second, and after power-up it needs about a second to stabilise before the first reading.
For Arduino you’ll find a ready-made DHT11 library in seconds, but for our board there is no official one, and the ones floating around online vary quite a bit in quality. Well, who needs one anyway? We’ll write our own.
How the DHT11 communicates
The DHT11 uses a single data line that is shared by both the microcontroller and the sensor. When nobody is talking, a pull-up resistor keeps the line HIGH (most DHT11 modules already have one on board; if you use the bare sensor, add a resistor of around 5–10 kΩ between the data pin and VCC). Both sides can pull the line LOW to send a signal and then release it again. Information is encoded in the duration of the pulses, so the whole trick is to measure time with microsecond precision.
A complete reading goes like this:
- Start signal (microcontroller): The microcontroller pulls the line LOW for at least 18 ms to wake up the sensor, then releases it. The pull-up brings the line HIGH again, and the microcontroller switches to listening.
- Response (sensor): After 20-40 µs, the sensor answers by pulling the line LOW for about 80 µs and then releasing it HIGH for about 80 µs. If you don’t see this response, something is wrong with the wiring, the timing, or the sensor.
- Data (sensor): The sensor sends 40 bits. Every bit starts with a LOW pulse of about 50 µs, followed by a HIGH pulse whose length tells the value: about 26–28 µs means 0, and about 70 µs means 1. So you don’t really need to measure the LOW part; the length of the HIGH part is what matters.
- End: After the last bit, the sensor pulls the line LOW for about 50 µs and releases it. The line goes back to idle HIGH.

The 40 bits are sent most significant bit first and form five bytes:
| Byte | Content |
|---|---|
| 1 | Humidity, integer part |
| 2 | Humidity, decimal part |
| 3 | Temperature, integer part |
| 4 | Temperature, decimal part |
| 5 | Checksum |
The checksum is the sum of the first four bytes, keeping only the lowest 8 bits. If your calculated sum doesn’t match byte 5, the reading is corrupted and should be discarded. On the DHT11, the decimal parts are usually zero (some newer versions send a temperature decimal), which matches the sensor’s 1 % and 1 °C resolution. I think reading 40-bits and the checksum in the end are the most challenging parts in this project so I would like to give you this code-snippet to trigger the thought process:
/* 3. Read 40 Bits */
for (int j = 0; j < 5; j++) {
    for (int i = 0; i < 8; i++) {
        while (HAL_GPIO_ReadPin(GPIOB, GPIO_PIN_8) == GPIO_PIN_RESET);

        delay_us(40);

        if (HAL_GPIO_ReadPin(GPIOB, GPIO_PIN_8) == GPIO_PIN_SET) {
            data[j] |= (1 << (7 - i));
            while (HAL_GPIO_ReadPin(GPIOB, GPIO_PIN_8) == GPIO_PIN_SET);
        }
    }
}

/* 4. Checksum Verification */
if (data[4] == ((data[0] + data[1] + data[2] + data[3]) & 0xFF)) {
    *humidity = data[0];
    *temperature = data[2];
    return 1;
}
The outer loop goes through the 5 bytes, the inner loop through the 8 bits of each byte (MSB first). For every bit, the code waits until the 50 µs LOW part ends, then waits 40 µs and looks at the line again. A “0” bit is only about 28 µs HIGH, so by then the line is already LOW again; a “1” bit is about 70 µs HIGH, so the line is still HIGH. If it’s HIGH, the bit is set with data[j] |= (1 << (7 - i)), and the code waits for the rest of that HIGH pulse to finish before moving on.
Finally, the checksum (byte 5) is compared with the sum of the first four bytes. If they match, the integer parts of humidity (byte 1) and temperature (byte 3) are returned and the function returns 1 for success.
Timing is everything
The difference between a 0 and a 1 is only about 40 µs, so HAL_Delay(), which works in milliseconds, is far too coarse. You’ll need a way to wait and measure in microseconds. There are two good options on our board. The first is to set up a hardware timer (e.g. TIM2) with a prescaler so that its counter increments once every microsecond, and then read the counter to measure how much time has passed. The second is the DWT cycle counter built into the Cortex-M7 core, which counts every CPU clock cycle.
For this project, set the HCLK to 216 MHz in the clock configuration of STM32CubeMX (this is the maximum for the STM32F767). With the CPU running at 216 MHz, one microsecond equals 216 clock cycles, which gives us plenty of resolution. Be careful when you configure a timer, though: timers don’t necessarily run at the HCLK frequency. With HCLK at 216 MHz, the timers on the APB1 bus (like TIM2) typically run at 108 MHz, so a prescaler of 108 − 1 gives exactly one tick per microsecond. Always check the clock tree in CubeMX to see the actual timer clock.
A few practical tips that will save you some headaches:
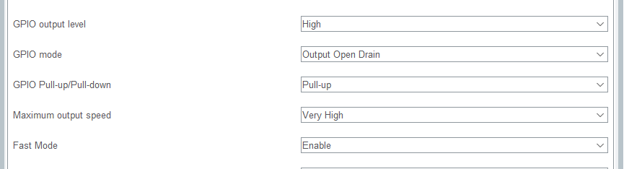
- Configure the data pin as an open-drain output. The pin then only pulls the line LOW or releases it, and you can still read its input state while it’s released, so you don’t need to switch the pin between output and input mode in the middle of the communication. Actually just set your pin like this config:
- Don’t print anything to the serial port while you’re reading the 40 bits. Sending text takes time and will ruin your timing. Read all the bits first, store them, and print afterwards.
- Always use timeouts when waiting for the line to change. If the sensor doesn’t answer, a
whileloop waiting for a HIGH level will hang your program forever.
Project steps
- Find the datasheet of the DHT11 and check the pinout of your module and whether it already has a pull-up resistor on the data line.(Note: yes, there is if you want to skip this step.)
- Set up your circuit. Power the sensor from the 3.3 V pin of the Nucleo board and connect the data pin to a GPIO pin.
- Start your STM32CubeMX project, set HCLK to 216 MHz, configure the data pin as an open-drain output, and set up a timer (or plan to use the DWT counter) for microsecond timing. You must think about what numbers you will write for prescalar and ARR values.
- Generate the initial code and open the project in PlatformIO.
- Your program must start by printing a header message on the serial monitor, e.g. “Welcome to the DHT11 weather station”.
- Write a microsecond delay function and test it before going further, for example by toggling a pin or an LED and checking that 1,000,000 µs really is one second.
- Send the start signal and check that the sensor responds with its 80 µs LOW and 80 µs HIGH pulses. Print a message such as “Sensor found” or “No response” so you know where you are.
- Read the 40 bits by measuring the duration of each HIGH pulse, and assemble them into five bytes.
- Verify the checksum, and every two seconds print the humidity and temperature, e.g. “Humidity: 45 %, Temperature: 23 °C”, or an error message if the checksum is wrong.
- +🌶️🌶️ Put your code into a small reusable driver with its own
dht11.canddht11.hfiles and a simple function such asDHT11_Read(&humidity, &temperature)that returns an error code when something goes wrong. Congratulations, you’ve just written your own sensor library!
P6: Ultrasonic distance measurement 🌶️🌶️🌶️🌶️
Bats hunt in complete darkness, and they do it by shouting. A bat sends out a short, high-pitched call and listens for the echo; the longer it takes for the echo to come back, the farther away the object is. In this project, we’ll do exactly the same thing with the HC-SR04 ultrasonic sensor, and all the microcontroller really has to do is measure time. Like the DHT11 project, it’s all about precise microsecond timing, but this time the result is something you can see changing right in front of you as you move your hand.
The HC-SR04 has two round “eyes”, but they’re actually a speaker and a microphone. Both are piezoelectric transducers: a piezoelectric material deforms when a voltage is applied to it and, the other way around, produces a voltage when it’s deformed by a sound wave. One transducer (marked T) sends out sound, and the other (marked R) receives the echo. The sensor works at 40 kHz, which is well above the roughly 20 kHz upper limit of human hearing, so you won’t hear a thing (though your dog might).
The electronics on the module take care of generating the sound burst and detecting the echo, so the interface to the microcontroller is refreshingly simple: one pin to start a measurement and one pin that tells you how long the sound was travelling.
How the HC-SR04 communicates
- Trigger: The microcontroller sets the Trig pin HIGH for at least 10 µs and then LOW again.
- Burst: The module sends out a burst of 8 ultrasonic pulses at 40 kHz and sets the Echo pin HIGH.
- Echo: When the reflected sound arrives back at the receiver, the module sets the Echo pin LOW again. The length of the HIGH pulse on the Echo pin is the time the sound needed to travel to the object and back.
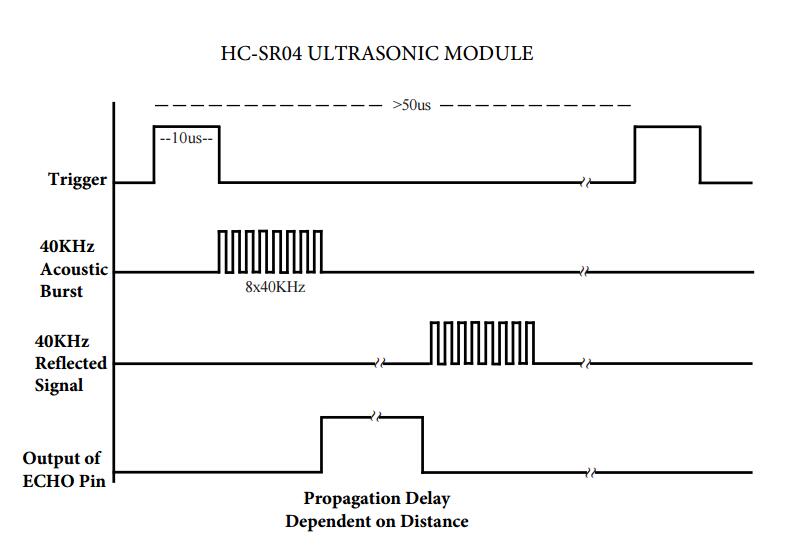
If nothing reflects the sound, the Echo pin stays HIGH for a long time (on most modules around 38 ms) before giving up. Wait at least 60 ms between measurements, so that echoes from the previous burst have died out and don’t confuse the next reading.
From time to distance
Sound travels at about 343 m/s in air at 20 °C, which is 0.0343 cm per microsecond. Since the Echo pulse covers the way there and back, the distance is half of the total path:
\[d = \frac{t \cdot v}{2} = \frac{t \cdot 0.0343\ \text{cm/µs}}{2} \qquad \text{or simply} \qquad d\ [\text{cm}] \approx \frac{t\ [\text{µs}]}{58}\]So an Echo pulse of 580 µs means the object is about 10 cm away. The sensor works reliably from about 2 cm to around 4 m. Keep in mind that the speed of sound depends on the air temperature (roughly +0.6 m/s per °C), and that soft or angled surfaces such as clothes, curtains, or a tilted book may absorb or deflect the sound instead of reflecting it back. So if your readings jump around, it’s not always the code’s fault.
⚠️ The HC-SR04 needs a 5 V supply to work properly, so power it from the 5 V pin of the Nucleo board. This means the Echo pin also outputs 5 V pulses. Most STM32F767 pins are 5 V tolerant (marked FT in the pin table of the datasheet), but not all of them, so either check the datasheet and choose a 5 V tolerant pin for Echo, or add a simple voltage divider (e.g. 1 kΩ and 2 kΩ) to bring the signal down to about 3.3 V. The Trig pin is not a problem: a 3.3 V HIGH from the STM32 is enough for the sensor to recognise it.
Timing is everything (again)
To get a resolution of about 1 cm, you need to measure the Echo pulse with a precision of about 58 µs, and better precision gives you millimetres. HAL_Delay() won’t do. Set HCLK to 216 MHz in STM32CubeMX and use a hardware timer that ticks once every microsecond (remember that timers on the APB1 bus run at 108 MHz with this setting, so a prescaler of 108 − 1 gives 1 µs per tick). You’ll need it both for the 10 µs trigger pulse and for measuring the Echo pulse.
The simplest way to measure the Echo pulse is to wait until it goes HIGH, note the timer value, wait until it goes LOW, note the timer value again, and subtract. Just like in the DHT11 project, never wait without a timeout, otherwise a disconnected sensor will freeze your program.
Project steps
- Find the datasheet of the HC-SR04 and identify its four pins: VCC, Trig, Echo, and GND.
- Set up your circuit. Power the sensor from 5 V, connect Trig to a GPIO output, and connect Echo to a 5 V tolerant GPIO input (or through a voltage divider).
- Start your STM32CubeMX project, set HCLK to 216 MHz, configure the Trig and Echo pins, and set up a timer for microsecond timing.
- Generate the initial code and open the project in PlatformIO.
- Your program must start by printing a header message on the serial monitor, e.g. “Welcome to the ultrasonic distance meter”.
- Write a function that sends the 10 µs trigger pulse, measures the length of the Echo pulse in microseconds, and returns it.
- Convert the pulse length to a distance and print it on the serial monitor every 200 ms, e.g. “Distance: 23.4 cm”. Print a message such as “Out of range” when no echo is received. Check your readings against a ruler: how accurate is your sensor?
P7: IR Distance measure 🌶️🌶️🌶️🌶️
(Note - I haven’t finish this code solution - so I have no solution manual for this. If you make it work, share iit with me afterwards :) )
Measuring distance with sound works nicely, but sound is slow and spreads out in a wide cone. Light is a different story: it travels in a narrow beam and doesn’t care about air temperature. The catch is that light is far too fast to time with a microcontroller, since it covers a metre in about 3 nanoseconds. So how can a cheap sensor measure distance with light? It doesn’t measure time at all. It uses geometry.
In this project, we use the Sharp GP2Y0A21YK0F infrared distance sensor. It measures distances from about 10 to 80 cm and gives the result as a simple analog voltage, so on the hardware side it’s one of the easiest sensors to connect. The challenge is on the software side: the voltage is not proportional to the distance, and turning it into centimetres takes some measuring, some maths, and a bit of patience. That’s where the chillies come from.
How it works: triangulation
The sensor contains an infrared LED and, a short distance next to it, a position sensitive detector (PSD) behind a lens. The LED sends a narrow beam of invisible infrared light forward. When the beam hits an object, part of the light is reflected back and focused by the lens onto the PSD. Because the LED and the detector sit side by side, the reflected light comes back at an angle, and this angle depends on the distance: light from a nearby object lands at one end of the detector, while light from a distant object lands closer to the other end. The PSD reports where the light spot lands, and the electronics inside the sensor convert this position into an output voltage.
This method is called triangulation, because the LED, the detector, and the object form a triangle whose shape depends on the distance. A nice side effect is that the result depends on the position of the light spot rather than its brightness, so the reading is much less affected by the colour of the object than you might expect. Very shiny, transparent, or dark surfaces can still cause trouble, though.
The sensor measures continuously on its own, roughly every 40 ms, and updates its output voltage after each measurement. There is no trigger pin and no protocol: you just read the voltage with the ADC whenever you like.
From voltage to distance
This is where it gets interesting. The output voltage is highest when the object is close (a little over 2 V at 10 cm) and drops as the object moves away (about 0.4 V at 80 cm), but not in a straight line. Doubling the distance does not halve the voltage. Over the working range, the relationship is approximately an inverse one and can be described with a power law:
\[d \approx a \cdot V^{\,b}\]where d is the distance, V is the output voltage, a and b are constants (with b negative) that you determine from your own measurements. Every sensor is a little different, so values copied from the internet are only a starting point.
There’s one more trap: below about 10 cm, the curve turns around and the voltage starts to decrease again as the object gets closer. This means that a reading of, say, 1.5 V could mean an object at 17 cm or one at 3 cm, and the sensor has no way of telling you which. In practice, you make sure objects can’t come closer than 10 cm, for example by mounting the sensor a little behind the front edge of your robot or setup.
⚠️ The sensor needs a 5 V supply, so power it from the 5 V pin of the Nucleo board. Its output voltage stays below the 3.3 V limit of the ADC, but check the datasheet of your exact sensor to be sure before connecting it. The sensor also draws current in short, strong pulses whenever the LED fires, which can make the supply voltage, and therefore your readings, noisy. The datasheet recommends a capacitor of at least 10 µF between VCC and GND, placed close to the sensor.
Project steps
- Find the datasheet of the GP2Y0A21YK0F and identify its three pins (VCC, GND, and Vo). The connector is small, so check the pin order carefully; the wire colours of the cable are not always standard.
- Set up your circuit. Power the sensor from 5 V, add the capacitor between VCC and GND, and connect Vo to an ADC-capable pin.
- Start your STM32CubeMX project and enable the ADC channel of the pin you’ve chosen.
- Generate the initial code and open the project in PlatformIO.
- Your program must start by printing a header message on the serial monitor, e.g. “Welcome to the IR distance meter”.
- Every 100 ms, read the ADC and print the raw value and the voltage. Move your hand in front of the sensor and watch how the values change. Can you find the distance where the voltage reaches its maximum?
- Calibrate your sensor: place a flat object (a book or a piece of cardboard) at known distances, e.g. every 5 cm from 10 to 80 cm, and write down the voltage for each one. Plot the results and see for yourself how non-linear the curve is.
- Use your calibration data to convert voltage to distance. You can either fit the power law above to find a and b (a spreadsheet or a few lines of Python will do), or store your measurements in a lookup table and interpolate linearly between the two nearest points. Print the distance, e.g. “Distance: 34 cm”, and print “Out of range” when the voltage is outside your calibrated range.
- +🌶️ You’ll notice that the readings jump around a bit. Make them more stable by taking several samples and using the median instead of the average, which ignores the occasional wild spike. As an extra challenge, let a timer trigger the ADC conversions and use DMA to collect the samples in the background, so your main loop doesn’t have to wait for them. - although DMA solution wihtout anything else meaningful in your main might be overkill.